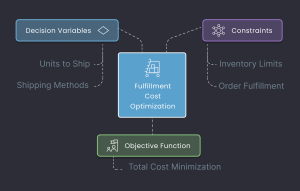
How to Deliver Perfect Orders at Scale by Balancing, Not Overriding Smart Systems
How a global CPG leader improved their Perfect Order Index by 12% by aligning planning, supply, and logistics systems to operate around a shared objective.
Meet Andrew, the VP of Supply Chain Planning
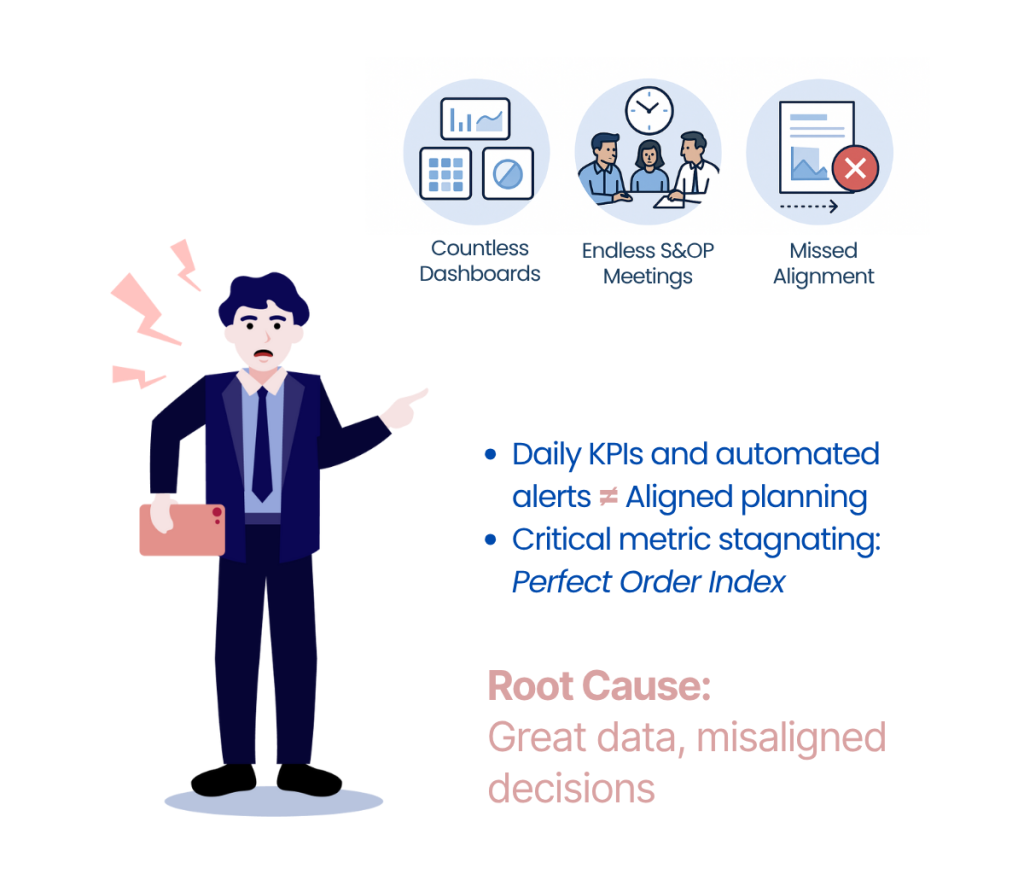
Andrew joined a leading consumer goods company with a clear mission: close the gap between forecast and reality. At his previous job, S&OP meetings were held three times a week, each one dominated by disconnected Excel spreadsheets and manual comparisons of forecast vs. actuals. The team had built multiple dashboards in Power BI to support these reviews, but the process remained labor-intensive and failed to align cross-functional teams around shared goals. Frustrated by the lack of impact, Andrew moved on.
At his new company, the S&OP process appeared far more mature. Each team had its own KPIs, reviewed daily with automated alerts. At first glance, it seemed like a model of advanced planning. But Andrew quickly realized the organization had hit a wall. Despite the sophistication, they were struggling to move the needle on one critical metric: the Perfect Order Index.
The Disconnect Beneath the Dashboards
Defined as the percentage of orders delivered on-time, in-full, damage-free, and with accurate documentation, the Perfect Order Index is a composite KPI that reflects the end-to-end health of the supply chain. Andrew dove into the underlying systems: demand sensing, inventory optimization, and financial planning, and saw a familiar pattern: the data was strong, but the decisions were misaligned.
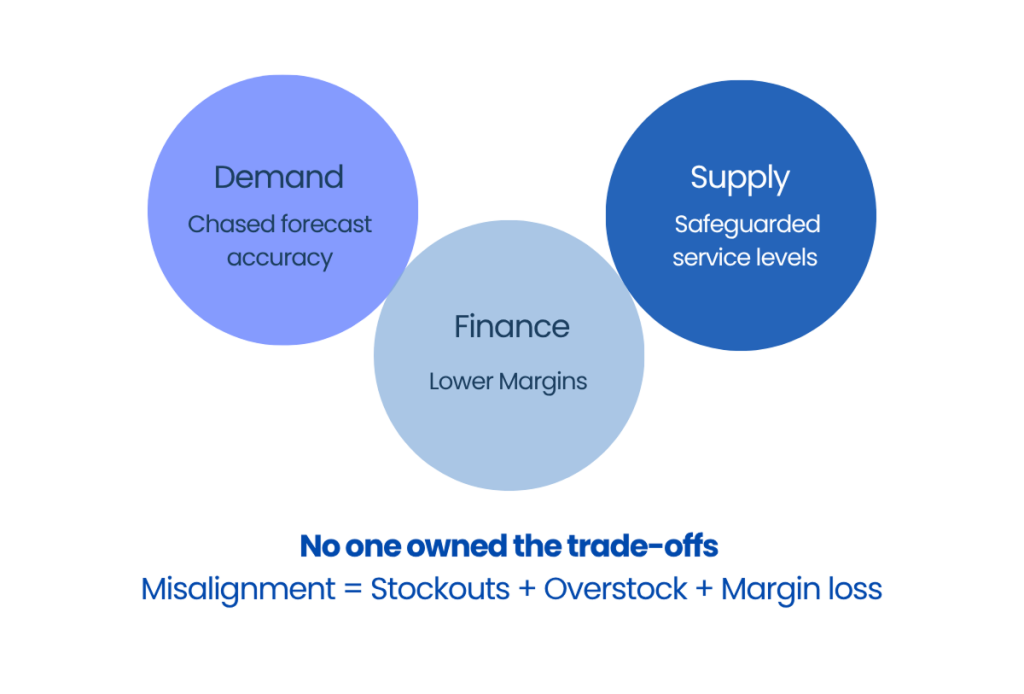
Everyone optimized their own domain:
- Demand focused on forecast accuracy.
- Supply prioritized service levels.
- Finance pursued margin targets.
But no one owned the trade-offs between them.
For example, the demand team forecasted a major promotion for a top-tier SKU to drive revenue growth. To ensure high service levels, the supply team increased safety stock across regions. But finance, concerned about rising carrying costs and margin compression, pushed to reduce inventory. The result? Misalignment. Some regions stocked out while others overstocked—hurting both service and margin, and ultimately lowering the Perfect Order Index.
What ProfitOps Did Differently
That’s when Andrew turned to ProfitOps, not just to improve forecast precision, but to align every planning node around business value. It wasn’t about more dashboards. It was about making decisions that actually deliver perfect orders.
“ProfitOps doesn’t just monitor plans, it aligns, simulates, and orchestrates them toward a defined objective.”
Most enterprise planning systems can analyze data. A few can even optimize locally. But very few can operate with an explicit business objective in mind, like improving the Perfect Order Index, reducing margin leakage, or releasing working capital.
That’s what sets ProfitOps apart.
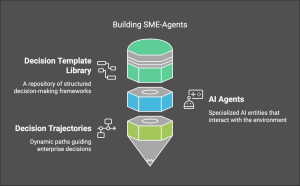
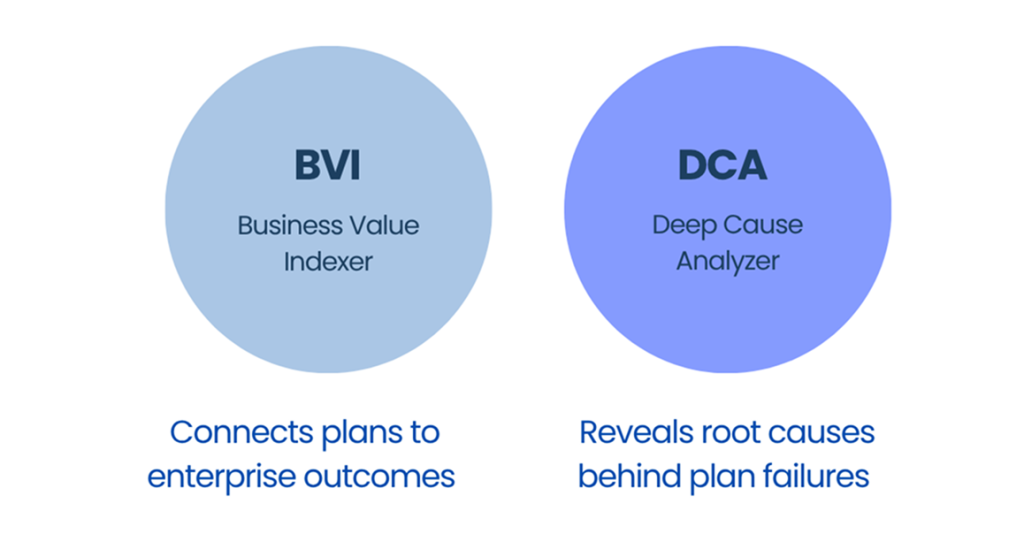
At the core are two intelligent agents:
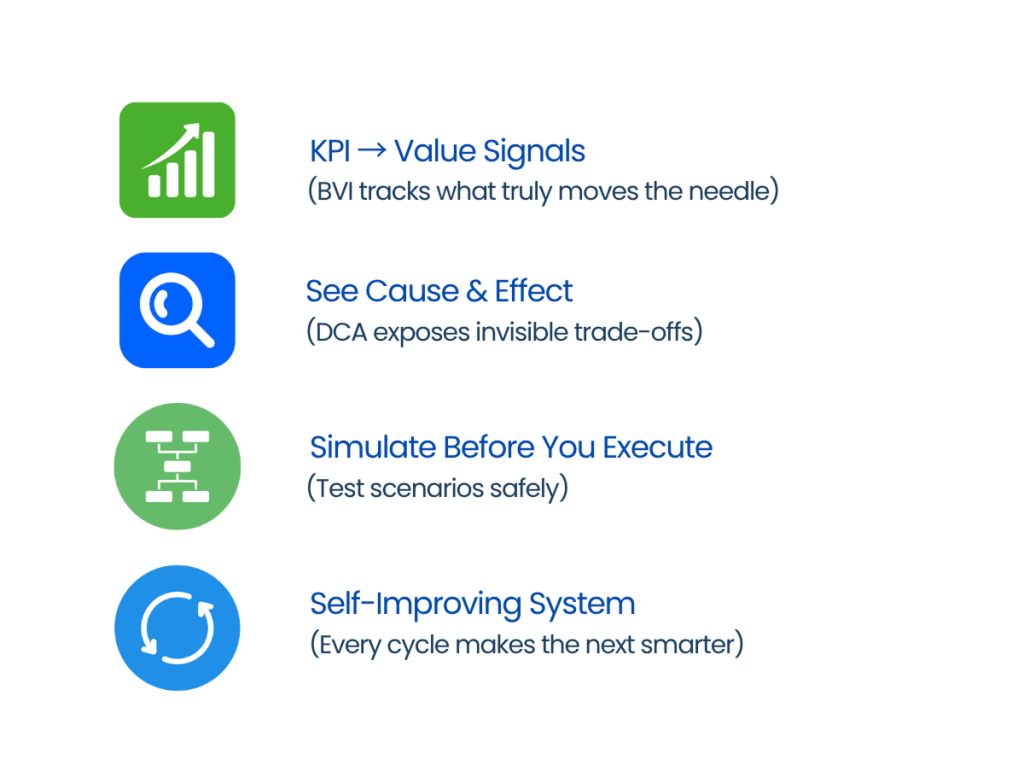
- Business Value Indexer (BVI): Tracks cross-functional health, not just in isolation, but in relation to enterprise objectives. It surfaces how combinations of demand, supply, and finance plans influence metrics like forecast value-add, inventory carrying cost, service loss, and margin leakage.
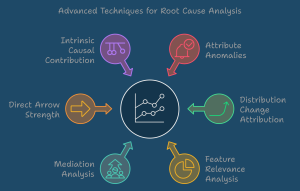
- Deep Cause Analyzer (DCA): Goes beyond reporting. It uncovers the root causes of why plans fail, whether it’s due to overstated promotional lift, hidden lead time volatility, or poor mix alignment.
Four Ways ProfitOps Changes the Game:
Within weeks, BVI & DCA exposed one such chain reaction:
- Slotting changes were increasing replenishment labor by 24% in one zone.
- That zone’s congestion then led to slower pick rates.
- Slower picks delayed packing and caused missed truck cutoffs.
- Missed cutoffs triggered expedited shipping, the silent killer of TCPO.
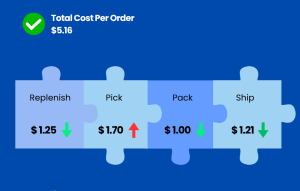
With these insights, Rick used the ProfitOps Simulation Room to test a new slotting–replenishment–labor configuration. The simulation predicted a 14% drop in TCPO (from $6.00 to $5.16) if the three systems were rebalanced, even if it meant slightly longer travel time per pick.
Uncovering the Hidden Gaps with ProfitOps
What starts as visibility becomes adaptive, value-driven orchestration. Instead of asking “Is the forecast right?”, ProfitOps asked: “Are these plans delivering value to the business?”
The answer? Not always.
- Promotions in Tier 1 markets were overforecasted by 18%, but supply plans stayed static
- This drove $6.4M in excess working capital
- Tier 2 cities faced 12% more stockouts, undercutting service levels
- Margin leakage wasn’t from cost, but from mismatched mix and poor prioritization
What looked like well-run planning turned out to be offsetting gains and losses, cancelling value in the middle.
Simulation Room to the Rescue
To course-correct, Andrew used the Simulation Room to test a coordinated planning scenario:
- Rebalanced demand inputs using historical promo elasticity
- Tuned supply buffers for lead-time volatility, not static rules
- Aligned replenishment logic with margin-led priorities, not just forecasted volume
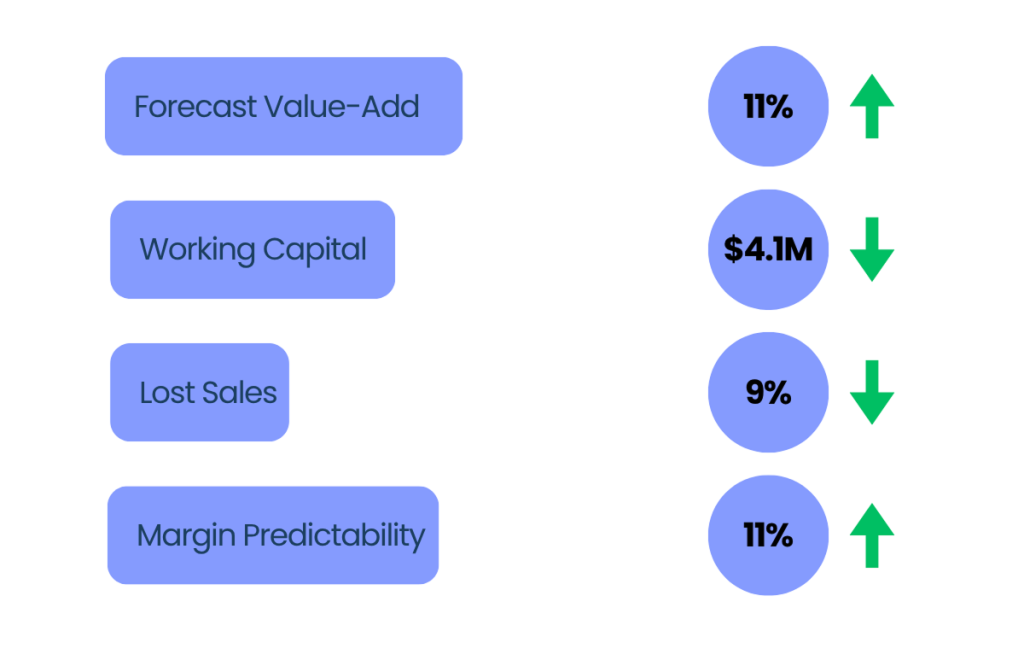
The Results – From Forecasting to Value-Oriented Planning
- Forecast Value-Add (FVA) ↑ 22%
- Working Capital ↓ $4.1M
- Lost Sales ↓ 9%
- Margin Predictability ↑ 11%
Conclusion
Andrew’s story shows that better dashboards don’t guarantee better decisions.
ProfitOps helped him go beyond siloed KPIs to orchestrated, value-driven planning.
The result? Smarter trade-offs, fewer misses, and more perfect orders—at scale.
Ready to transform the way you solve business challenges?
Discover how ProfitOps pinpoints root causes, optimizes operations, and prevents disruptions before they escalate. Our AI-driven Deep Cause Model turns complex data into clear, actionable insights, empowering smarter, faster decision-making.
Shravan Talupula
Founder, ProfitOps

