Part-2: Root Cause Analysis for Warehouse Automation: A Synthetic Data Exploration
In our previous post, we explored how Root Cause Analysis (RCA) can transform warehouse operations by pinpointing inefficiencies and reducing costly errors. Now, it’s time to pull back the curtain and reveal the technical sophistication that powers these insights. Warehouse systems are complex, with thousands of interconnected processes, and surface-level fixes often fail to address the deeper, underlying issues. That’s why we approach the problem using advanced causal analysis—an approach that not only detects anomalies but traces them back to the root causes, revealing the hidden mechanisms driving inefficiencies.
In this post, we’ll take you through our step-by-step method, from generating synthetic datasets that simulate real-world warehouse operations to deploying cutting-edge anomaly scorers and Shapley Values to explain and quantify the factors behind each anomaly. This is where data science meets operational strategy, combining machine learning with causal modeling to deliver actionable insights that go far beyond traditional analytics. Let’s dive into the technical journey that makes it all possible.
Data Generation: The Power of Synthetic Datasets
In causal AI, synthetic data generation enables us to simulate real-world operations with precise control over variables, relationships, and anomalies. In our case study on warehouse automation, for example, we generated a dataset of 1,000 packages with predefined characteristics and injected 100 anomalies across critical stages like barcode scanning, weight checks, sorting, and diversion. By doing this, we can analyze the system’s behavior under controlled conditions and track the exact pathways that lead to failures.
One of the most significant advantages of using synthetic data is that we know the root causes of each anomaly in advance. This foresight allows us to judge the accuracy of our causal models with high precision. By comparing the model’s output to the actual root causes we embedded, we can measure how well the model identifies the causal pathways and attributes responsibility.
For instance, if we know a “barcode unreadable” anomaly is triggered by a specific SKU substitution, we can evaluate whether the model correctly traces this issue back to the faulty SKU. This comparison ensures that our root cause analysis techniques are effectively capturing the true causal relationships.

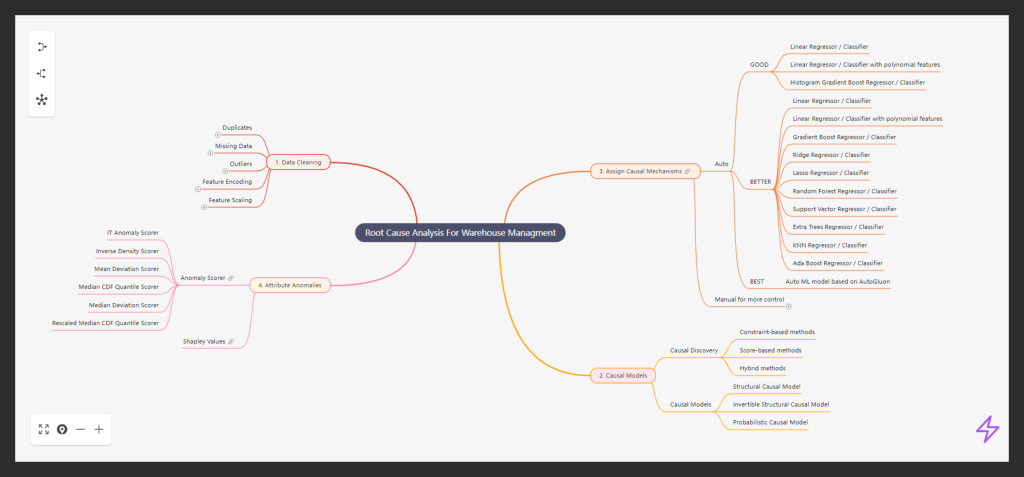
Step 1: Data Cleaning – Preparing the Foundation
Before any meaningful analysis, it’s vital to ensure the data is clean and free of errors that could skew results. This step is like laying a solid foundation for a house. If your data is flawed, the conclusions you draw will be equally flawed.
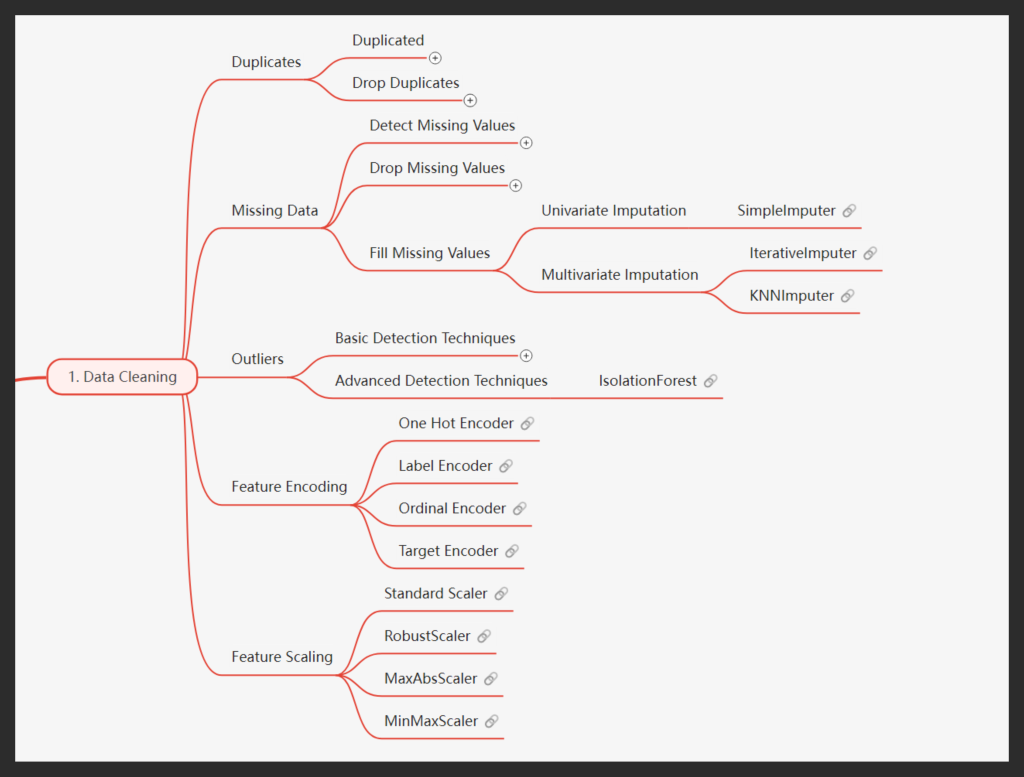
Duplicates: By removing duplicated rows or variable subsets, we ensured no redundancy would obscure the results.
Missing Data: Imputation techniques, such as SimpleImputer or IterativeImputer, allowed us to handle missing values. This ensured we didn’t lose important information while maintaining data integrity.
Outliers: Advanced techniques like IsolationForest helped detect and handle outliers, which could otherwise cause misleading conclusions.
Feature Encoding and Scaling: We standardized variables like SKU substitutions and weights to facilitate caus
How it connects: Cleaning the data ensures we start with a reliable dataset, free from noise and inconsistencies, thus setting the stage for accurate root cause analysis.
Step 2: Causal Models – Mapping Relationships
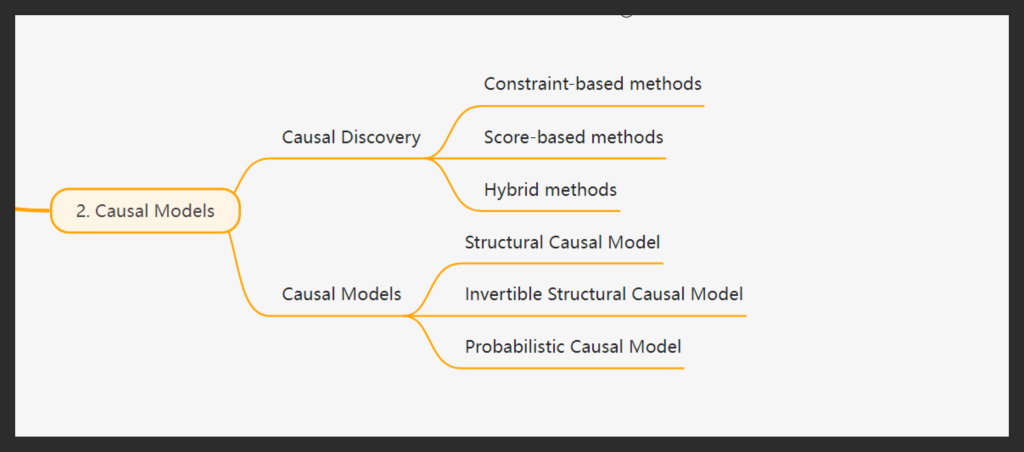
Causal Discovery and Domain Knowledge Integration: Our approach begins with automated causal discovery using the latest algorithms, such as PC, FCI, and GES, which we then complement with domain expertise in an iterative process to ensure the highest level of accuracy. We recognize that data alone cannot convey causal relationships, as causality is fundamentally a philosophical concept. Data primarily speaks the language of correlation, and without guiding this correlation toward causal understanding, we risk flawed inferences. This is why we devote considerable attention to carefully constructing causal relationships and representing them through Directed Acyclic Graphs (DAGs), which serve as the foundation for accurate causal analysis.
Formalizing the DAG into a Structural Causal Model (SCM): After constructing the Directed Acyclic Graphs (DAGs), we formalize them into a Structural Causal Model (SCM), establishing a foundation for more in-depth analysis. The SCM translates the visual representation of relationships into mathematical equations, allowing us to define interactions between variables clearly. This process encompasses various types of models: Structural Causal Models (SCMs) delineate relationships in mathematical terms, enabling hypothesis testing and simulations; Invertible Structural Causal Models facilitate reverse-engineering processes to identify causes from observed effects; and Probabilistic Causal Models integrate probabilities into the causal framework, capturing uncertainties for a more nuanced understanding. This step effectively transforms theory into practice, empowering us to conduct robust causal analysis that leads to actionable insights.
Step 3: Assign Causal Mechanisms – Refining Insights
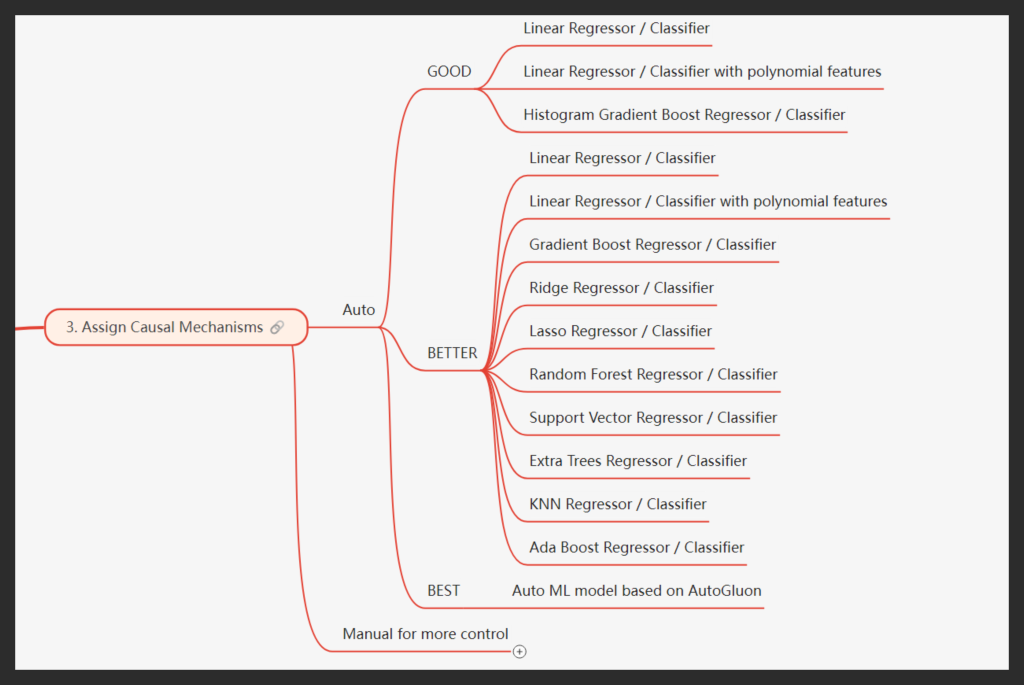
After establishing the causal models, the next crucial step was to assign causal mechanisms to each node. The purpose of assigning these mechanisms is to transform the abstract causal relationships into quantifiable models that allow us to measure the influence of one variable on another, enabling us to accurately assess how variables interact and contribute to observed outcomes.
For each node, we tested a set of nine distinct models, including Random Forest Regressors, Gradient Boosting, Ridge Regressors, Lasso Regressors, Support Vector Machines, and others. We systematically fitted all these models to the data and evaluated their performance based on accuracy and other key metrics.
The model with the highest accuracy was selected as the approved causal mechanism for that node, ensuring that the representation of each causal pathway was as precise and reliable as possible. This process was repeated iteratively for every node in the causal structure, ensuring that the entire graph was covered and every causal relationship was backed by the most suitable model. By assigning these mechanisms, we ensured that our causal analysis was not only theoretically sound but also robust and data-driven, providing a clear path to actionable insights.
Step 4: Attribute Anomalies – Highlighting the Culprits
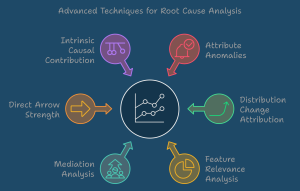
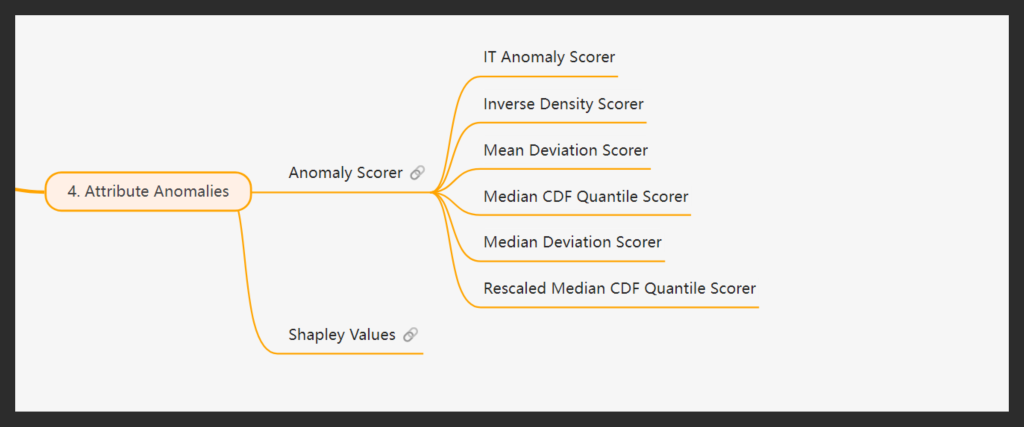
Once the causal mechanisms are assigned, we now have a fully functional model that can be used to attribute anomalies for individual anomalous instances. The next step is to identify which specific attributes or features are responsible for these anomalies. To do this, we use anomaly scorers— tools that evaluate how “anomalous” a particular sample is by comparing it against the expected distribution of values.
Our platform supports six different ways to detect anomalies, each designed to catch issues in a variety of real-world situations. Some methods focus on how rare or extreme a value is, others highlight when something strays far from what’s typical, and a few are tuned to spot subtle or hard-to-detect problems. By offering a range of scorers, we ensure that no matter the scenario, we can accurately identify and explain what went wrong.
Shapley Values
The attribution process also utilizes Shapley Values to explain the contribution of each feature to the detected anomaly. Shapley Values provide a mathematically sound method for distributing the overall anomaly score across all features, ensuring fair and interpretable attribution. They allow us to:
Quantify Feature Contributions: Shapley Values break down the anomaly score into contributions from individual features, giving a clear picture of which attributes are responsible for the anomaly.
Ensure Robustness: Even in complex, non-linear models, Shapley Values offer reliable and consistent attribution, providing confidence in the results.
Increase Transparency: By explaining how much each feature contributed to an anomaly, Shapley Values enhance the interpretability of the model, making it easier to understand the underlying causes.
This combination of anomaly scorers and Shapley Values enables us to not only detect anomalies but also pinpoint the exact features responsible, providing a clear path for corrective action.
Streamline Anomaly Attribution with Our Causal AI Platform
As we’ve demonstrated, the process of detecting and attributing anomalies through advanced causal modeling is intricate and requires careful attention to detail at each step. From assigning causal mechanisms to using anomaly scorers and Shapley Values, every part of the workflow demands significant computational resources and expertise. This complexity can make it difficult for many organizations to implement an effective and scalable anomaly detection system.
Fortunately, our platform automates this entire process, significantly reducing the time and effort required. By streamlining tasks like anomaly scoring, causal mechanism assignment, and feature attribution, our platform allows companies to focus on resolving issues and improving performance, rather than getting caught up in the technical challenges. This automation ensures that businesses can consistently identify the root causes of anomalies in real-time, driving more effective decision-making and operational improvements.
Conclusion
By applying our advanced causal analysis techniques and leveraging automation, your business can achieve precise and actionable insights that traditional methods often overlook. Our rigorous approach, combined with anomaly attribution features like Shapley Values, empowers organizations to uncover hidden issues and make impactful changes that enhance performance. With our platform handling the heavy lifting, you can focus on strategic initiatives that drive growth and efficiency.
Ready to revolutionize your anomaly detection and fulfillment strategy?
Explore how our platform can help you identify root causes, optimize logistics, and minimize operational disruptions. Schedule a demo with our experts today and discover how our cutting-edge solutions can elevate your fulfillment processes to new heights!
Shravan Talupula
Founder, ProfitOps

